If storytelling has a face, it would be Nancy Duarte. Her Ted Video is not only a brillant explanation of how great communicators have in common, it is also a piece of her personal story. She is an hero of her own story.
She has written a trilogy with her 3 books on Presentations : the first two (Slide:ology and Reasonate) in paper version are two very beautiful objects. Even at that time where we were not talking so much about data, some chapters were already talking about how to present data / numbers.
Her last book is focusing on that part and it is nearly 10 years after her first book. And I just wanted to share top 5 ideas or moments.

1 – StoryTelling to unleash the value of data
« Leaders in all sectors spend large sum of money collecting and analyzing data, yet the value comes when someone convincingly communicates what data reveals »
In her introduction, the « science of story » is the key element to communicate because stories engage our senses, bring us closer together or move us to feel and act. You have on one side data (cold, factual, objective) and on the other side stories (warm, emotional, subjective).
It is about anyone working for an organization : there is a huge gap between exploring the data vs explaining it or even use it to inspire. Any leader should develop this ability to communicate with data.
Another way to say it, this is about data fluency : not just be able to read and understand the data but be able to write a story or a novel. This is her version of data literacy to data fluency.
2 – Data is your light saber

For years, Nancy Duarte has always explained that as a presenter, you are like yoda and the audience is the hero. It is not the presenter who is the hero, he is like a mentor. In this book, she adds that data could be your light saber
« When you use data to provide timely and critical guidance to decision-markets, you change organizational outcomes. You become the mentor and your data is the magical tool that gets unstuck on their journey ».
The question behind is do we still need to produce tons of numbers and graphics in a reporting tool without any context or story ?
3 – Data Storytelling is not about fancy dataviz
Nancy Duarte recommends strongly to stay with Bart chart, pie chart and line chart. « Complex visualisations can also look so authoritative that they lead people to suspend their judgment »

For her, it is much more important to be able to have clear titles, annotate insights onto charts to amplify a data point, to add math to data points like a % or a sum or explode data with a micro chart next to the main one. It is quiet far from BI tool current roadmap trying to add more complexities but she is definitely right because in real life (website, financial reporting), most of the dataviz are finally made in PowerPoint or a graphic tool. I don’t know any BI tool where you can just take it with you to do a presentation.
4 – Structure, Structure, Structure

The Nancy Duarte « Secret Sauce » : it starts with building a DataPOV that is « whatever the data is telling you, it’s speaking to you. You dove deep into the data perspective. You made nuanced observations, and the understanding you developed about what needs to be done and how to do it is yours ».
This DataPOV will be declined in supporting point with each slide structured by what, why and how. This is where Data jumps in and will support your analysis.
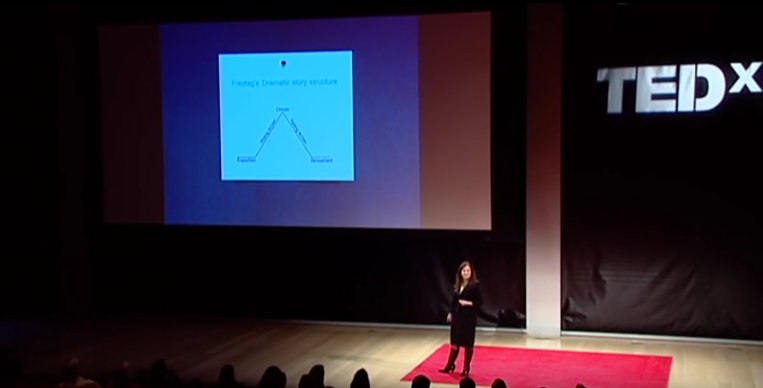
The executive summary is structured as a three act DataStory : a beginning where you have the main characters introduced, a « messy middle where adversarial forces are trying to defeat the hero who attempts to resolve the central conflict and the end where « the hero overcomes the challenge ».
Nancy Duarte introduced years ago the idea of « SlideDocs » : a visual document developed in presentation software that are intended to be read and reference instead of projected. This is the 3rd pillar with her first two books. You can download it and see how Data is shown and presented.
5 – The human side of data
It is her special touch, Nancy Duarte will always see the human side of everything. She cares so much about the audience and that’s why she finished her book with sound advices about how to talk about the data. Using numbers that people can imagine, talking about who are behind these numbers and the forces against them and doing storytelling using suspens like Alfred Hitchcock.
Again and it is a good conclusion, data is your magic trick, your light saber but at the end you have to tell a story. This is the difference between exploring the data and explaining the data.
